
Understanding USDA Plant Hardiness Zones and Why They Matter
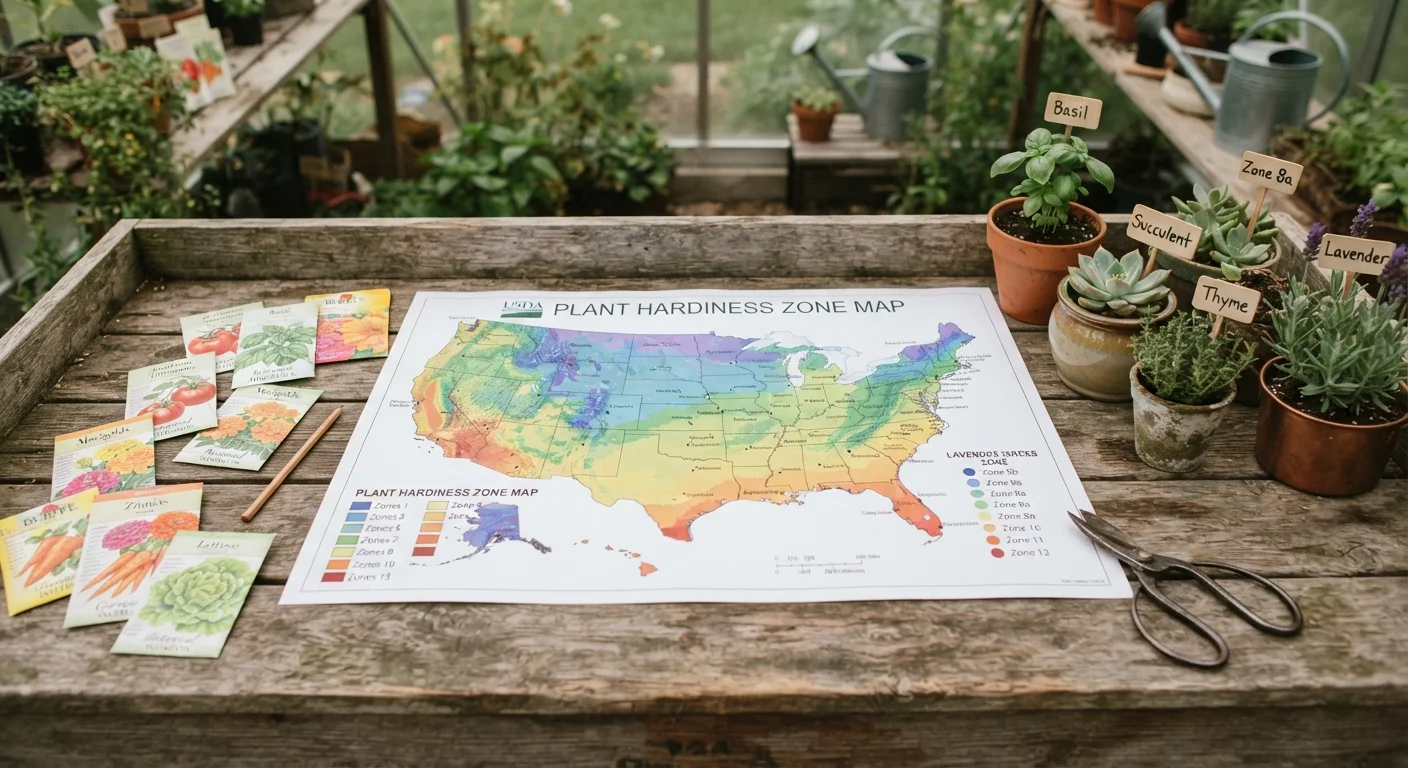
Photo credit: ProximityFinds.com | One-stop Reading Source
Your hardiness zone tells you which plants can survive your local winters. Here's how to find yours and use it to make smarter plant choices.
What Is a USDA Plant Hardiness Zone?
The USDA Plant Hardiness Zone Map divides the United States into 13 numbered zones - each representing a 10°F range of average annual minimum winter temperatures. Zones are further split into "a" and "b" half-zones, each covering a 5°F range. Zone 1 is the coldest (think interior Alaska), while Zone 13 covers tropical areas like southern Puerto Rico.
The map was first published in 1960 and has been updated periodically as temperature data improves. The most recent revision, released in 2023 by the USDA Agricultural Research Service, incorporates 30 years of weather station data from 1991-2020 - making it the most accurate version to date.
When a plant tag reads "Hardy to Zone 6," it means the plant can reasonably be expected to survive winters in Zone 6 and warmer. Understanding this single number can save you from losing plants to a hard freeze - and from playing it too safe by skipping cold-tolerant species that would thrive in your yard. See our guide to reading plant labels for a full breakdown of what plant tag information means.
| Total USDA Zones | 13 zones (1a through 13b) (USDA Agricultural Research Service) |
| Temperature Range per Zone | 10°F per full zone; 5°F per half-zone (USDA Plant Hardiness Zone Map) |
| Most Recent Map Update | 2023, based on 1991-2020 data (USDA Agricultural Research Service, 2023) |
| How to Look Up Your Zone | Enter ZIP code at planthardiness.ars.usda.gov |
| What the Zone Measures | Average annual minimum winter temperature only (USDA) |
How to Find Your Zone and Use It Wisely
Finding your zone takes seconds: visit the USDA's official Plant Hardiness Zone Map website (planthardiness.ars.usda.gov) and enter your ZIP code. The result shows your half-zone designation - for example, 7b - along with the corresponding temperature range.
Once you know your zone, use it as a baseline filter when selecting trees, shrubs, and perennials. Annuals and vegetables are less affected by hardiness ratings since they complete their life cycle in a single growing season, but perennials must survive repeated winters to return year after year.
Keep a few important caveats in mind:
- Microclimates matter. A south-facing wall, a low frost pocket, or an urban heat island can make your actual garden warmer or cooler than your zone suggests.
- Hardiness is only about cold. The zone map measures minimum winter temperatures - it tells you nothing about summer heat, humidity, rainfall, or soil type. A plant hardy in your zone can still struggle if other growing conditions don't match.
- Zone creep is real. The 2023 update shifted roughly half of the country slightly warmer compared to the previous 1990-2020 baseline. If you've been gardening by an older zone designation, it may be worth re-checking yours.
Hardiness Zone
A geographically defined area based on average annual minimum winter temperatures. Plants labeled for a given zone are expected to survive winters in that zone and warmer.
Microclimate
A localized climate condition that differs from the broader surrounding area. Factors like structures, pavement, shade, and elevation can create warmer or cooler spots within a single yard.
Perennial
A plant that lives for more than two years, dying back in winter and regrowing from its roots in spring. Hardiness ratings are most critical for perennials.
Annual
A plant that completes its entire life cycle - germination, growth, flowering, and seed production - within a single growing season.
Heat Zone
A classification system developed by the American Horticultural Society that measures the average number of days per year above 86°F. Used alongside hardiness zones for a fuller picture of growing conditions.
Pairing your hardiness zone with supplemental resources - like the American Horticultural Society's Heat Zone Map - gives a more complete picture of what will genuinely thrive where you live.
~50%
U.S. area shifted warmer in 2023 update
According to the USDA, approximately half of the contiguous U.S. shifted into a warmer half-zone in the 2023 map revision.
30 years
Weather data used for 2023 zone map
The 2023 USDA map is based on temperature records from 13,412 weather stations collected between 1991 and 2020.

Author
Home Editorial Team
Home Editorial Team is the collective byline for our editorial team and contributor network. Articles published under this byline or an editorial pen name are researched, written, and reviewed according to our editorial standards for clarity, consistency, and independence before publication.
View all articles →